The world is now starting to feel the importance of supply chain management. For months the world has been struggling with issues with the supply chain and now the fallout is coming.
The transportation industry saw a boom of freight, and
carriers responded by increasing their operations.
Eventually, the market crashed and over-capacity flooded the market creating what the industry termed as a “blood bath” with two major trucking companies filing for bankruptcy and nearly 800 carriers going out of business within the first 3 quarters of 2019.
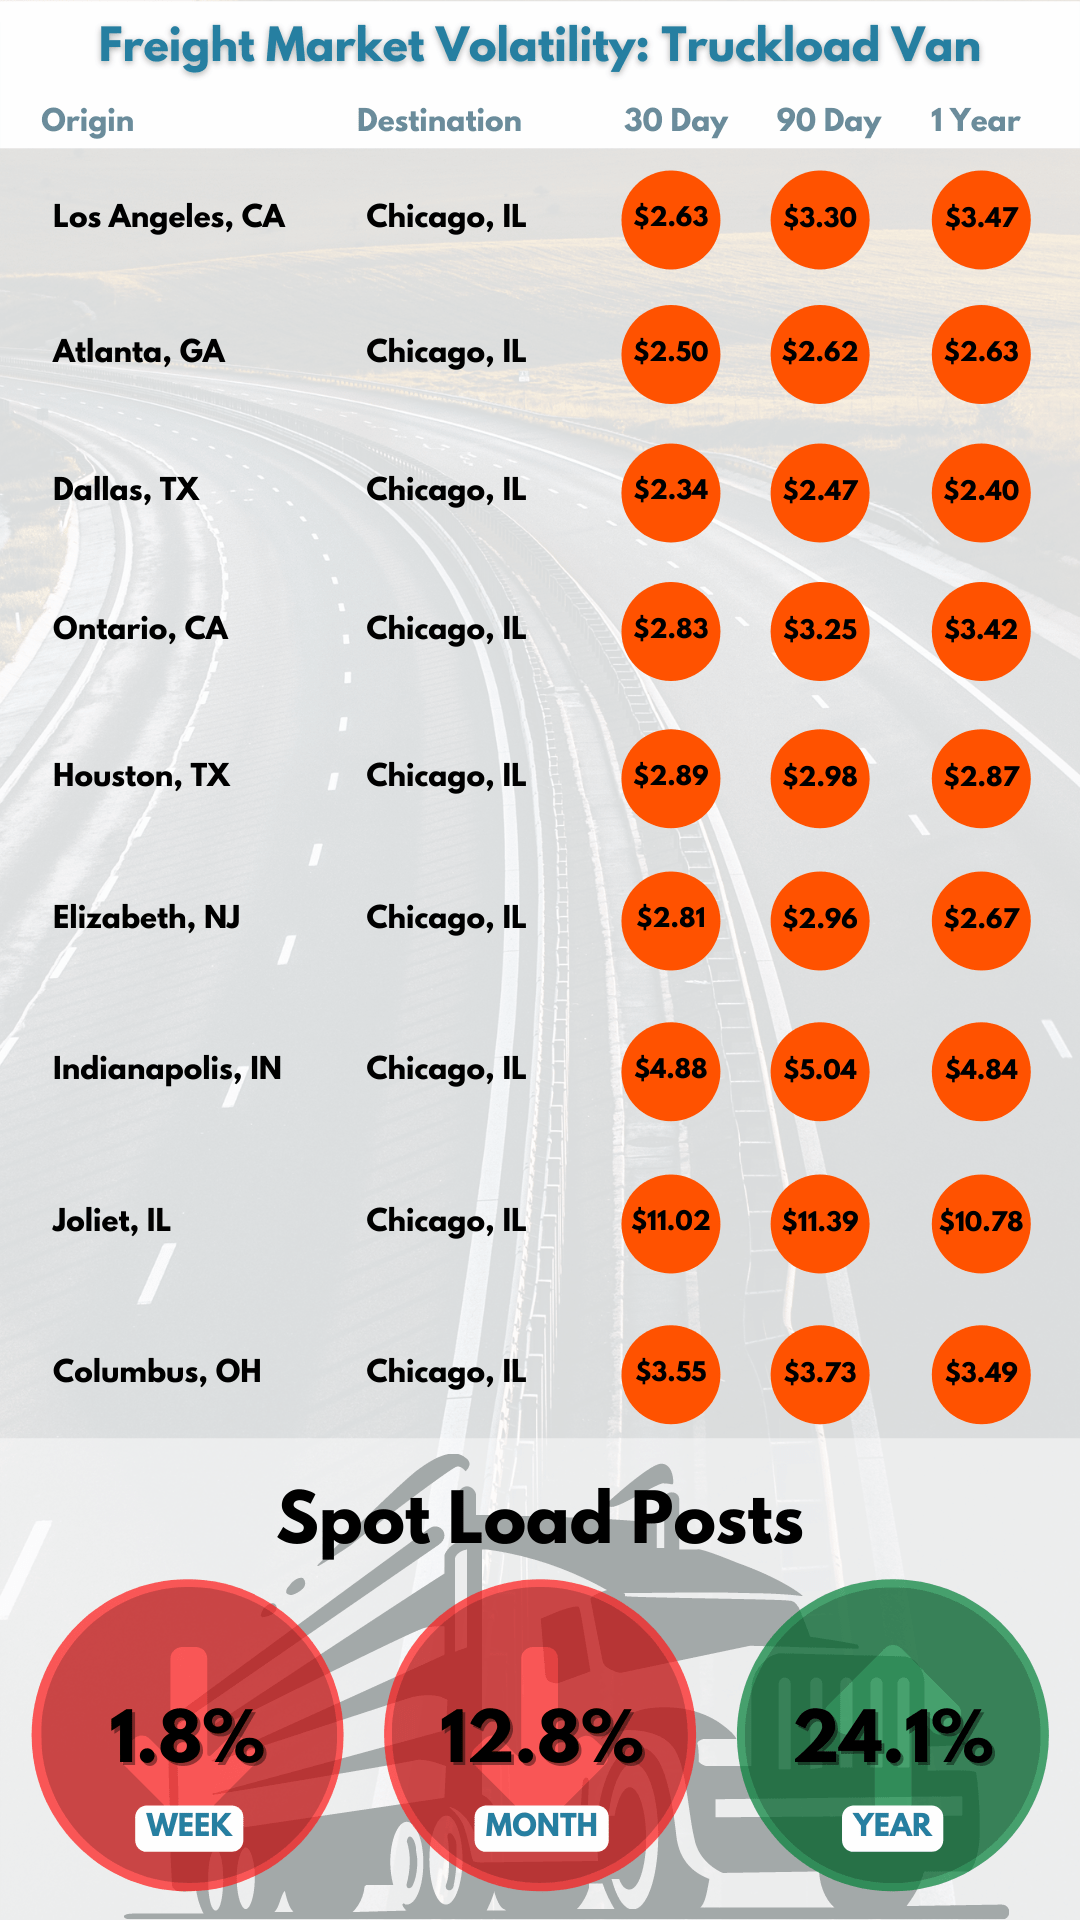
We pulled 10 common lanes over a 30, 90, and 1 year time period to see what the average cost per mile rate was according to DAT. Looking at these numbers you can see that spot rates are falling, which means if you are locked in a contracted rate it might be time to analyze your pricing.
Companies that are able to monitor their cost per mile in real time will be able mitigate any impact from changes affecting the industry. We have seen some trends emerging on how different factors such as inflation and fuel prices can affect an enterprise’s profitability, but there is still plenty we cannot foresee. In this volatile geo-political environment, it would be wise to know your numbers.
What insights do you have? Share your knowledge with us below!